 Morgan Camilleri
Work
Les Numéros de Demain
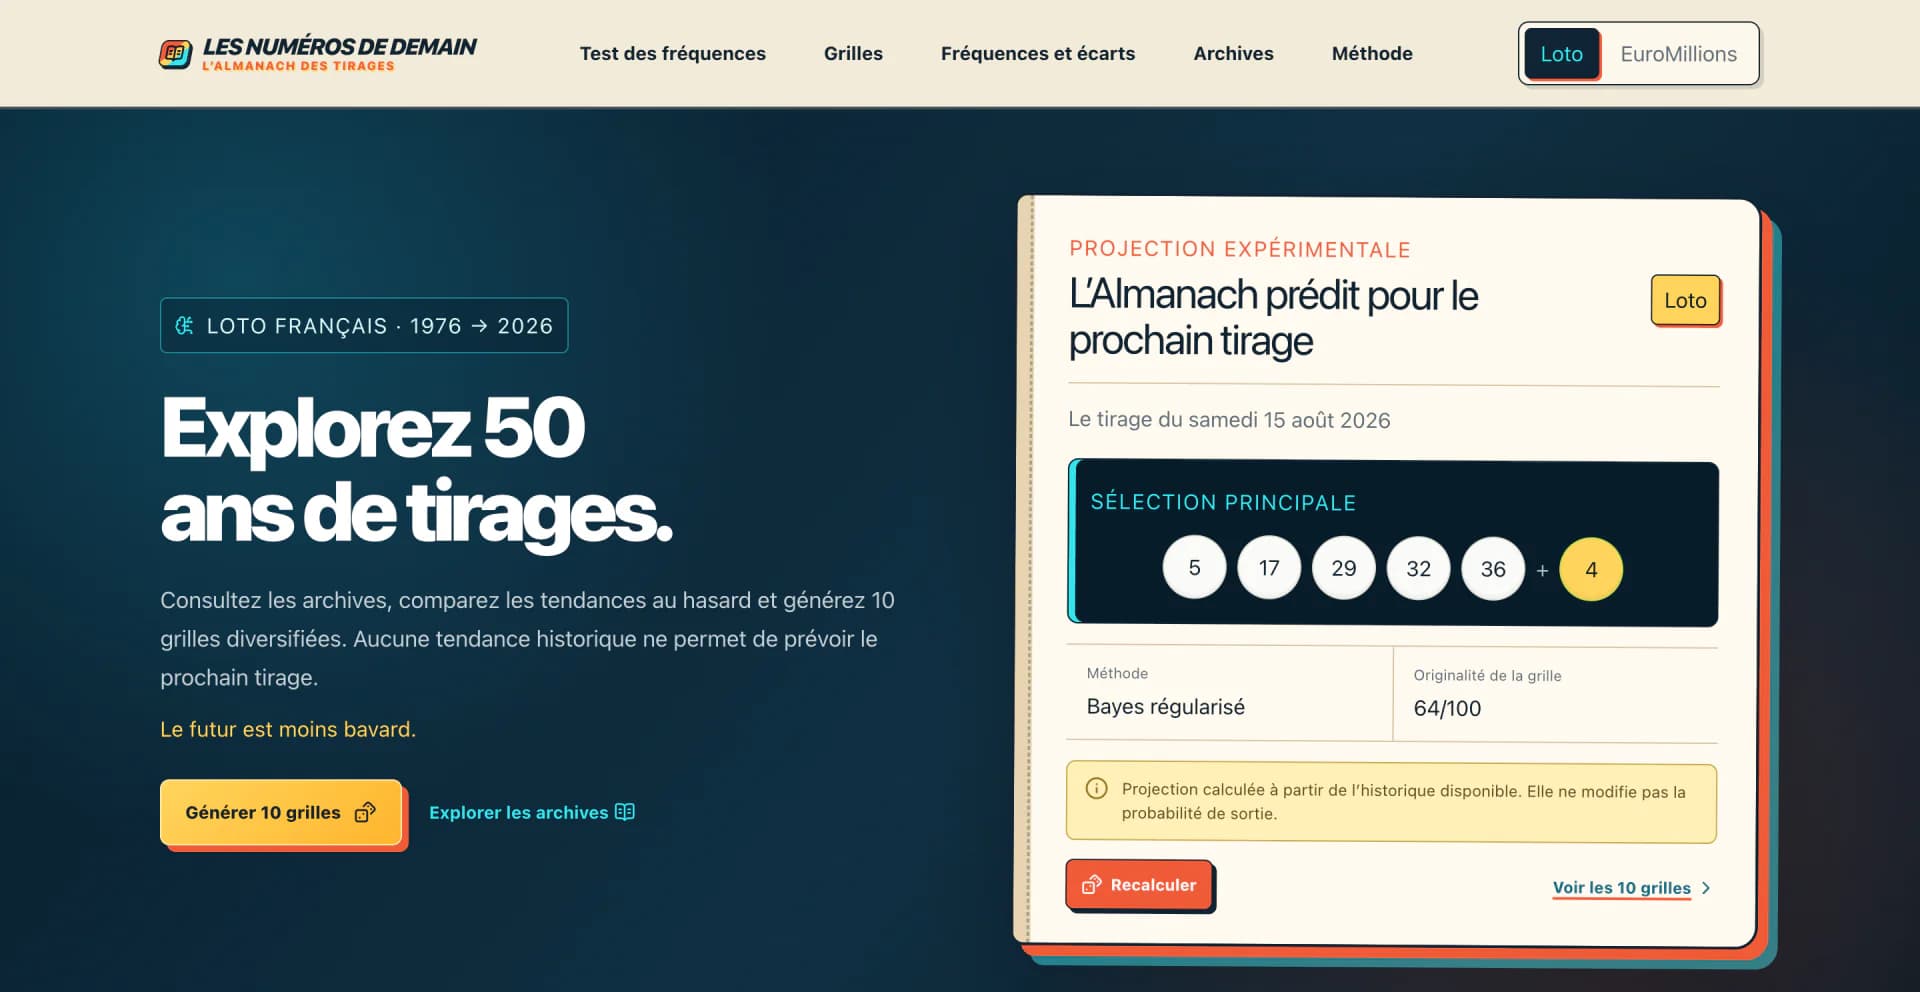
I took a deliberately absurd idea seriously: predicting tomorrow to get rich. I turned it into a product exercise combining mathematics, probability, data and a retro-futuristic interface.
Results
- 9,737normalised draws as of 13 August 2026
Verified facts
- Public product available on the web
- Archives sourced from official public FDJ data
- Backtest without temporal leakage, compared with randomness
Taking an absurd idea seriously
This is the kind of exercise I enjoy: an almost childlike question that brings popular culture, mathematics, probability, data and design into conversation. What if an almanac could actually reveal the next numbers?
The nod to Back to the Future is deliberate. In the film, a sports almanac promises a fortune to someone who already knows the future. Here, that fantasy becomes a playful way to examine our urge to find a loophole in randomness, cheat the game or turn the past into the future.
Defining an honest promise
The product had to remain engaging without suggesting that historical data can reveal the next result. Every valid grid keeps the same odds of winning.
The offbeat tone targets the machine's pretension, never the players. The joke only works if the boundary stays clear: frequencies describe the past, scores describe a combination and no index becomes a predictive claim.
Building usable data
The public FDJ archives cover several games, formats and file structures dating back to 1976. I collect, decode, normalise, deduplicate and sort them into one shared model.
The browser then receives a controlled snapshot. A visit never triggers a download from FDJ, and the latest valid dataset remains available if an update fails.
Testing instead of claiming
A backtest replays the draws in order. For each test, the frequency strategy can only see previously known results, then its score is compared with the expected result of a random grid.
This prevents temporal leakage and makes the conclusion falsifiable. The observed strategy remains at the level of chance: the experience helps explain uncertainty rather than manufacture certainty.
Making rigour part of the show
I did not want a financial dashboard or a fake predictive laboratory. The interface borrows from the visual language of the sports almanac in Back to the Future: ivory paper, midnight blue, cyan and coral, layered cards, technical grids and expressive typography.
The contrast is deliberate. For a moment, everything looks like a machine that could reveal tomorrow; then the data and warnings bring the experience back to mathematical reality. Humour does not replace the method: it makes it more approachable and memorable.
Making statistics understandable
The interface connects archives, frequencies, gaps, charts and the grid generator into one journey. Every visualisation leads to a conclusion expressed in plain language.
Conclusions stay connected to the charts that produce them. Probabilities, sources and warnings remain readable on mobile and large screens.
Shipping an operable product
The website is built with Next.js and computes its analyses in the browser from the normalised file. Data refreshes are handled separately from visitor traffic.
The product is packaged as a Docker image, checked before deployment and served behind Caddy on shared infrastructure. That separation keeps the public experience simple while making operations predictable.
Your project
A project to describe?
Describe your activity, your goals and the experience you would like to create.